Graph
Graph is a gh-element that allows to generate graphs using different item data. You can use graphs to track product sales, profit statistics or other things you wish by date.
Functional Characteristics
The purpose of this element is to display various statistics by dates. The graph can display different statistics at the same time for comparison.
Value Format
This element does not contains any value.
Element Options
All parts of the current element are configured with three groups of settings.
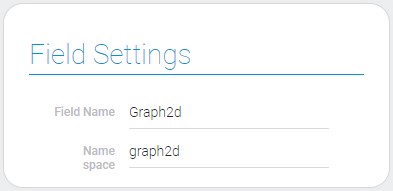
Field Settings
The first group is the standard set of field settings.

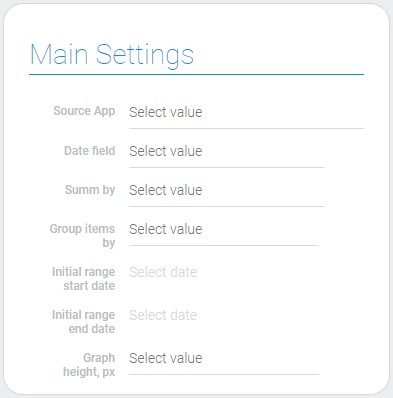
Main Settings
The main settings configures the main element functions and connects the certain application and fields.

| Name | Description |
|---|---|
| Source App | allows to select the source application; details... |
| Date field | allows to select the source date field; details... |
| Summ by | allows you to select the field by which the elements will be summarized; details... |
| Group items by | allows to select by which day period items will be grouped; details... |
| Initial range start date | allows to set the start date of the time range of the graph; details... |
| Initial range end date | allows to set the end date of the time range of the graph; details... |
| Graph height, px | allows to set the graph height; details... |
Source App
This is the application from which the desired fields and items will be taken.
Date Field
This is the date until which the items will be displayed on the chart. This field is one of the fields responsible for the placement of element points on the chart.
Summ By
This function allows to select the field by which the items will be summed. This means that this field is used for the vertical scale and for placing points of elements on the chart.
Group Items By
Select the day period by which the items dots will be grouped. This means that elements of the same period will be displayed on the same vertical line. There are five set value:
- Day
- Week
- Month
- Quarter
- Year
Initial Range Start Date
This is one of functions that allows you to set the start limit of the lower scale.
Initial Range End Date
This setting allows you to set the end date of the graph time period.
Graph Height
This is the height of the graph element. You can select the desired value in pixels.
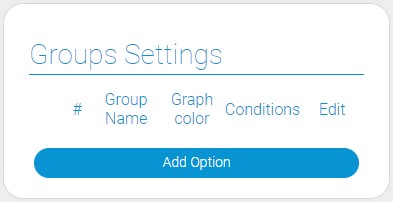
Groups Settings
The last group of settings allows to create a groups of items. They will be displayed in the graph as a similar connected points.

| Name | Description |
|---|---|
| Group Name | allows to enter the group name; details... |
| Graph color | allows to select the color of the group mark that will be displayed in the graph; details... |
| Conditions | allows to configure which items are contained in this group; details... |
| Edit | allows to edit or delete the group; details... |
Group Name
This is the name of the group, which you can enter yourself.
Graph Color
This is the color of the group mark. All elements of this group will be displayed on the graph as a point of the selected color.
Conditions
This feature allows you to add filters to create conditions that determine which items are contained in a particular group.
Edit
This column consists of two buttons which allows you to delete or edit the group.
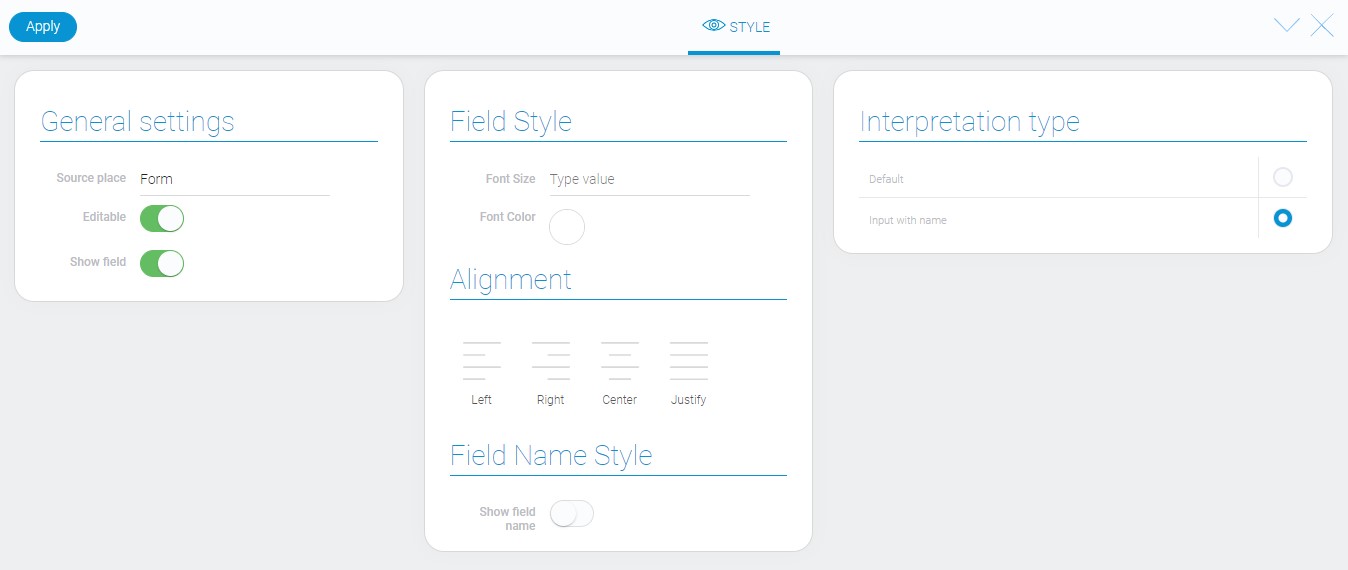
Element Style
Despite its complex appearance, the gh-element has only standard style settings. The graph interpretation types are described below.

Data Model
The graph data model contains only main element settings:
{
    "data_model": {
        "dateField": "678889",
        "groupItemsByRange": "month",
        "groups": [{
            "color": "#5e3987",
            "filters_list": [],
            "name": "Group Name"
        }],
        "height": "800",
        "initialXAxisRange": {
            "end": 1650488437784,
            "start": 1649883633326
        },
        "interpretation": [],
        "source_app_id": "28752",
        "sumByField": "679043"
    }
}
| Name | Type | Description |
|---|---|---|
| dateField | string |
contains ID of the date field |
| groupItemsByRange | string |
contains value by which items in graph will be grouped |
| groups | array |
contains all element groups and their settings |
| color | string |
contains hex code of the color of the group |
| filters_list | array |
contains filters that determine which items belong to this group |
| name | string |
contains the name of the group |
| height | string |
contains value of the graph height |
| initialXAxisRange | object |
contains data about the time limits of the lower scale which will be displayed in the element |
| end | number |
contains value of the limit start; date in milliseconds |
| start | number |
contains value of the limit end; date in milliseconds |
| interpretation | array |
contains all element interpretation types |
| source_app_id | string |
contains ID of the source application |
| sumByField | string |
contains the identifier of the field by which the items will be summed up |
Filtration
This element cannot be filtered out.
Interpretation
The graph has only one type of interpretation by default. It displays the customized graph.


 Edit document