Funnel Charts
Funnel Charts is a gh-element that allows to visualize the calculated data in the form of the funnel chart. It has its own calculation functions. You also can customize it as you wish.
Functional Characteristics
The purpose of this element is similar to the simple funnel charts. That is, the current gh-element is used to visualize some processes with data such as for recruitment or sales.
Value Format
This element does not have field value.
Element Options
The element has three groups of settings. One of them is responsible only for adjusting the appearance of the graphs, while the others are important for the operation of the element itself.
Field And Design Settings
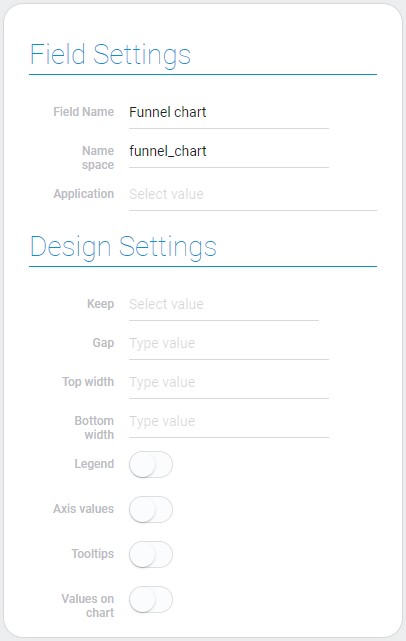
The first block of settings is separated on two groups. The first one contains standard field settings and one important additional option. The design settings are not mandatory, but they help you customizing charts.

| Name | Description |
|---|---|
| Application | allows to select the source application; details... |
| Keep | allows to select the side of the cases displaying; details... |
| Gap | allows to set the distance between trapeziums; details... |
| Top width | allows to set the width of the trapezium top; details... |
| Bottom width | allows to set the width of the trapezium bottom; details... |
| Legend | allows to display the legend for the chart cases; details... |
| Axis values | allows to display the Y axis values; details... |
| Tooltips | allows to display tooltips; details... |
| Values on chart | allows to display values on the chart; details... |
Application
This is the application from which the fields will be taken for calculations of funnel chart areas.
Keep
This function allows to determine where the funnel area will be located:
- Auto (center)
- Left
- Right
Gap
The gap is s distance between funnels areas.
Top Width
This is a setting that allows you to adjust the width of the areas at the top of the chart.
Bottom Width
The current settings allows you to set the width of the chart bottom.
Legend
Legend is a list of existing area marks in the upper left conner. They contains name and color of the certain funnel area. Their order is the same as the order of the cases in Case Settings. In addition, clicking on these labels allows you to show and hide the corresponding area.
Axis Values
This is the vertical axis on which the calculated values of areas are displayed.
Tooltips
These are pop-ups that appear when you hover your cursor over the certain area. The color of the funnel area, the name and the calculated value are displayed in the tooltips.
Values On Chart
The last function allows you to determine whether the calculated values will be displayed in the corresponding areas.
Cases Settings
The funnel chart is separated on the areas which show the certain data. That data is the result of the calculation of the selected fields. Cases Settings allows to configure the appearance of the areas, the type of calculation, and fields that will be used for it.

| Name | Description |
|---|---|
| Name | allows to enter the name of the case; details... |
| Color | allows to select the color of the case area; details... |
| Field calculate | allows to select the field by which the value of the case is calculated; details... |
| Aggregation | allows to select the type of the case value; details... |
| Conditions | allows to add filters that determine which items will be used in the current case; details... |
| Edit | allows to edit and delete cases; details... |
Name
This is the name of the the certain funnel area.
Color
This color is the selected color of the funnel area.
Field Calculate
This field by which the area will be calculated.
Aggregation
Due to this function you can select the type of the calculation. There are only two options:
- Sum
- Count
Conditions
The conditions are responsible for filtering out the items. Namely, they determine which elements will be used to calculate the current area using filters.
Edit
This column contains two buttons for each of area. One of them allows you to edit a case, the other allows you to delete it.
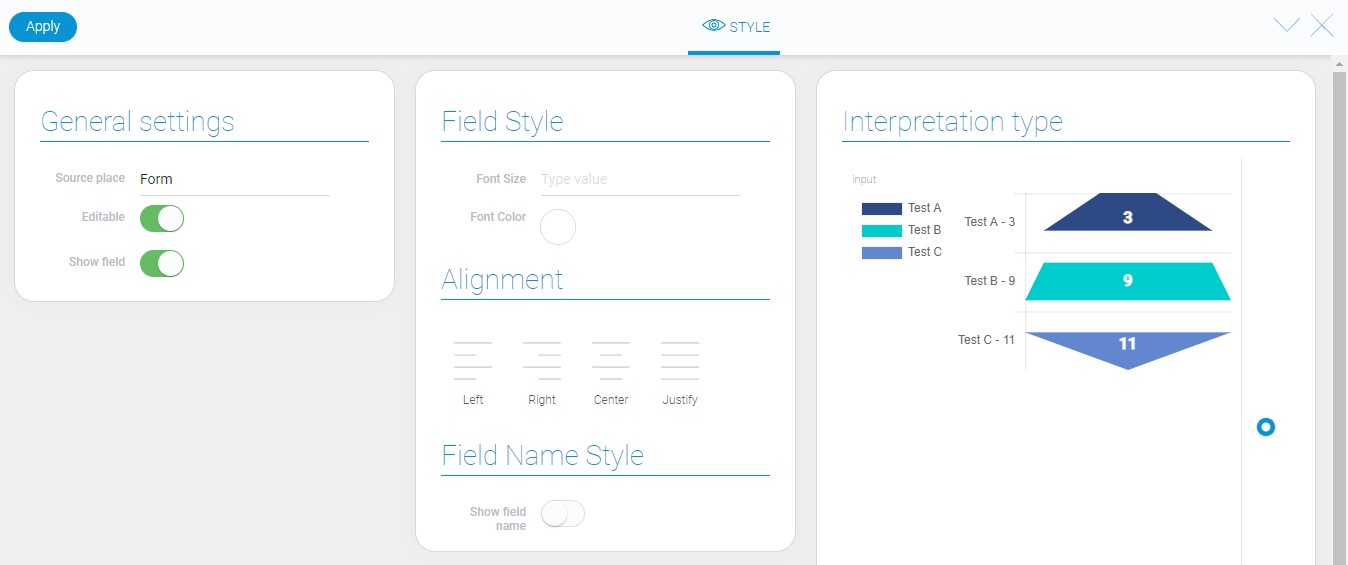
Element Style
The funnel chart has only standard settings that customize its style. Also his interpretation has not many variation.

Data Model
The element data model contains all values of its settings:
{
    "data_model": {
        "app_id": "28827",
        "calculate_type": "sum",
        "charts_option": [{
            "aggregation": "count",
            "color": "#2d4a84",
            "field_id_calc": "680004",
            "filters_list": [],
            "name": "sfd"
        }],
        "field_for_sorting": "",
        "filters_list": [],
        "height_charts": 400,
        "interpretation": [],
        "settings": {
            "axisValues": 1,
            "bottomWidth": "15",
            "gap": "45",
            "keep": "left",
            "legend": 1,
            "tooltips": 1,
            "topWidth": "",
            "valuesOnChart": 1
        }
    }
}
| Name | Type | Description |
|---|---|---|
| app_id | string |
contains ID of the source application |
| calculate_type | string |
contains value of the selected type of calculation |
| charts_option | array |
contains settings of all charts cases |
| aggregation | string |
contains value of the selected aggregation |
| color | string |
contains hex code of the charts color |
| field_id_calc | string |
contains ID of the field by which the charts values will be calculated |
| filters_list | array |
contains filters of the charts case |
| name | string |
contains name of the charts case |
| height_charts | number |
contains value of the chart height |
| interpretation | array |
contains all element interpretation types |
| settings | object |
contains values of design settings |
| axisValues | boolean |
shows whether the y axis will be displayed or not |
| bottomWidth | string |
contains value of the bottom width of funnel areas |
| gap | string |
contains value of the gap between the chart areas |
| keep | string |
contains value of location on the chart of areas |
| tooltips | boolean |
shows whether tooltips of the values will be used or not |
| topWidth | string |
contains value of the top width of funnel areas |
| valuesOnChart | boolean |
shows whether values of the calculation will be displayed on charts or not |
Filtration
This element cannot be filtered out.
Interpretation
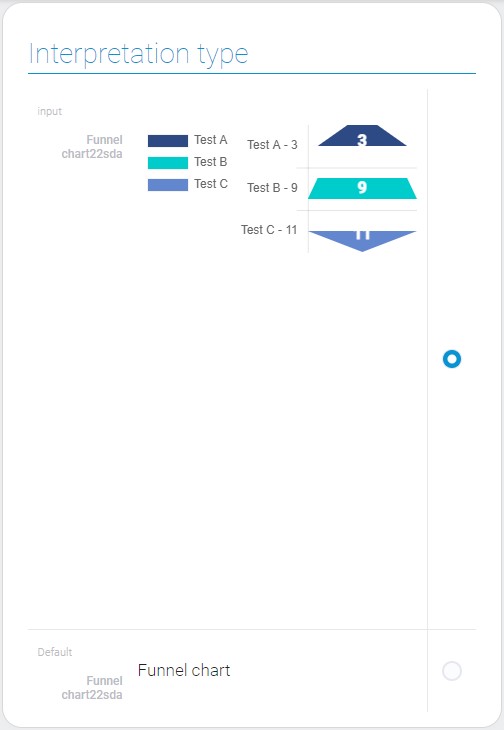
This gh-element has two types of interpretation:

Input
The first type of interpretation allows to display the calculated data in the form of funnel charts. It is an interactive type.
Default
This type allows to display only the name of the gh-element.

 Edit document