Charts
Charts is a gh-element that allows to make charts based on data of the application. This element provides functionality for selecting the data on the basis of which the chart will be built, as well as for customizing this chart.
Functional Characteristics
The obvious use of this element is to visualize some data, such as expenses and income. It is also useful for visualizing statistical data.
Element Options
The chart contains of three settings groups.
Field Settings
Besides two standard settings, there are lots of important settings.
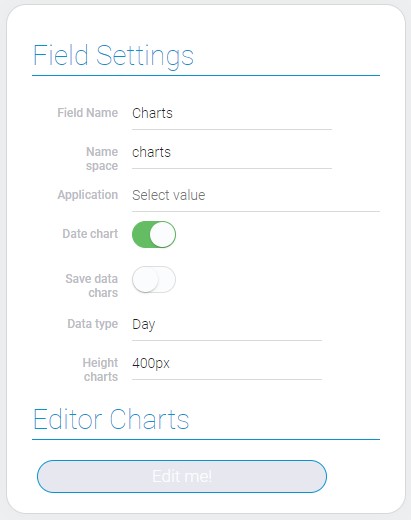
| Name | Description |
|---|---|
| Application | allows to select the source application; details... |
| Date charts | allows to use date charts; details... |
| Save data charts | allows to save data of the chart; details... |
| Data type | allows to select the type of the date data; details... |
| Height charts | allows to select the height of charts; details... |
| Edit me! | allows to open chart editor; details... |
Application
To generate an element diagram, you need initial data. To get it, you need to select the source application in the current option.
Only after app selection you can configure the charts.
Date Charts
This is the function that allows to group items by some time period.
Save Data Charts
Due to this option, the settings of the chart will be saved on the server.
Data Type
This is the period of time by which items will be grouped in date chart. There are five types:
- Hours
- Day
- Week
- Month
- Year
Height Charts
Th last function allows to set the height of the chart:
- 200px
- 400px
- 600px
- 800px
- 100%
Chart Editor
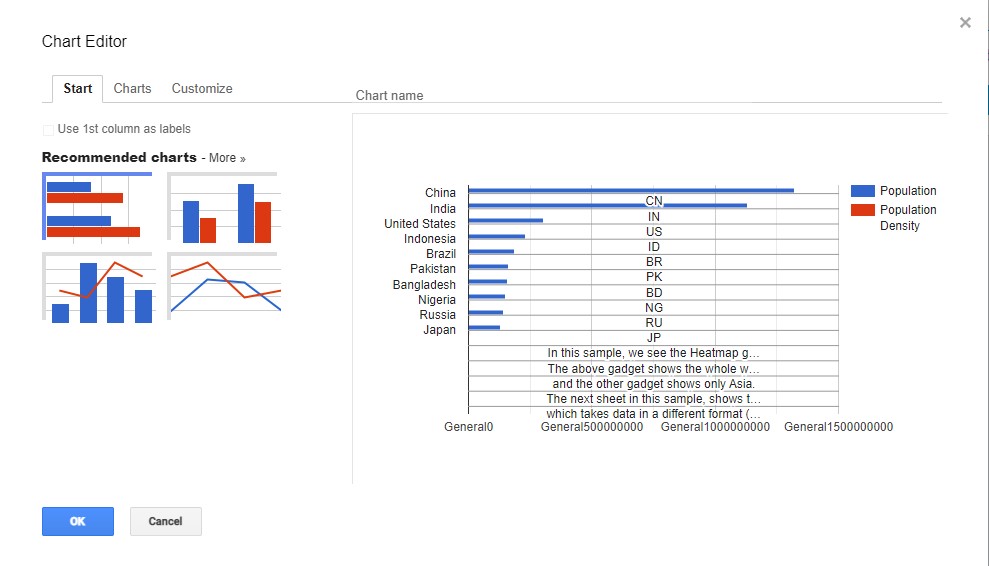
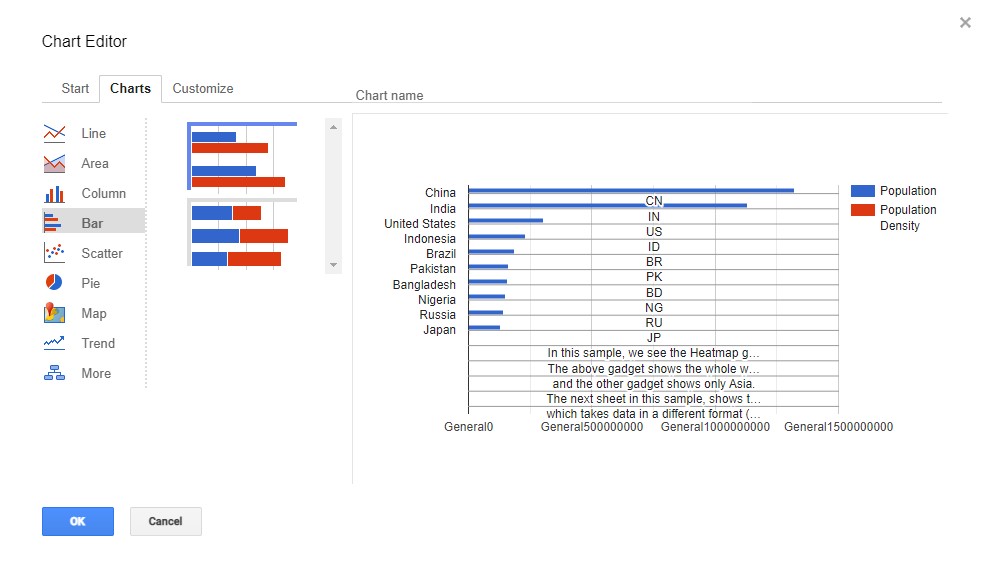
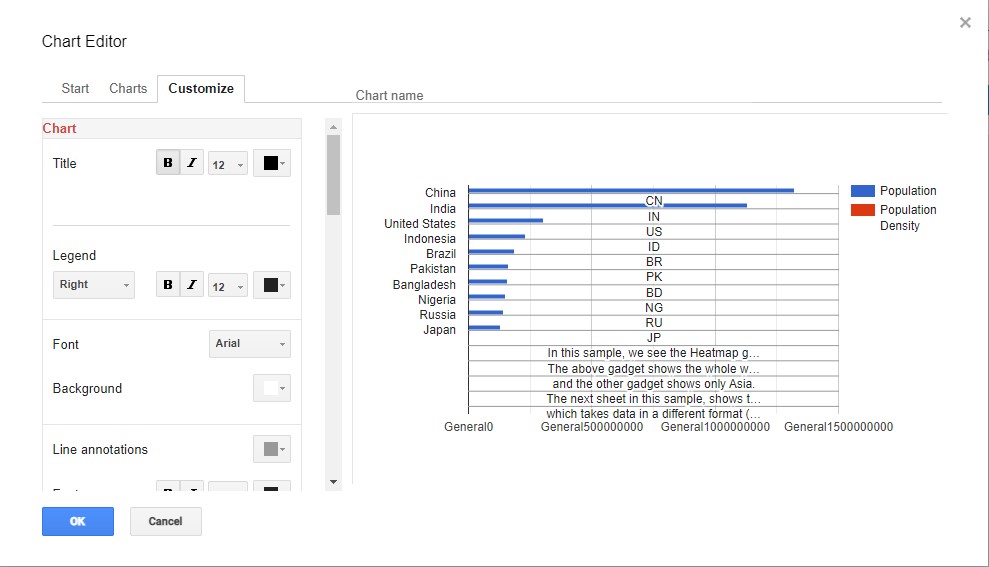
Current element use Google chart tool to customize chart appearance.
-
Start
-
Charts
-
Customize
Cases Settings
The graph can consist of several calculations. Each of them is configured using the following settings.

| Name | Description |
|---|---|
| Name | allows to enter the name of the case; details... |
| Field sort | allows to select the field by which the item marks will be sorted; details... |
| Field calculate | allows to select field by which marks will be calculated; details... |
| Aggregation | allows to select the type of the calculation; details... |
| Conditions | allows to select items that will be calculated; details... |
| Edit | allows to edit and delete the case; details... |
Name
This is the name of the configured option.
Field Sort
All items in charts will be sorted by this field.
Field Calculate
This is the field for calculation.
Aggregation
This is an action that allows you to aggregate items. There are five types of such aggregations:
- Sum
- Avg
- Count
- Min
- Max
Conditions
These are filters that determines which items will be used in charts.
Edit
This column contains two buttons. One allows you to edit a case, and the other allows you to delete it.
Element Style
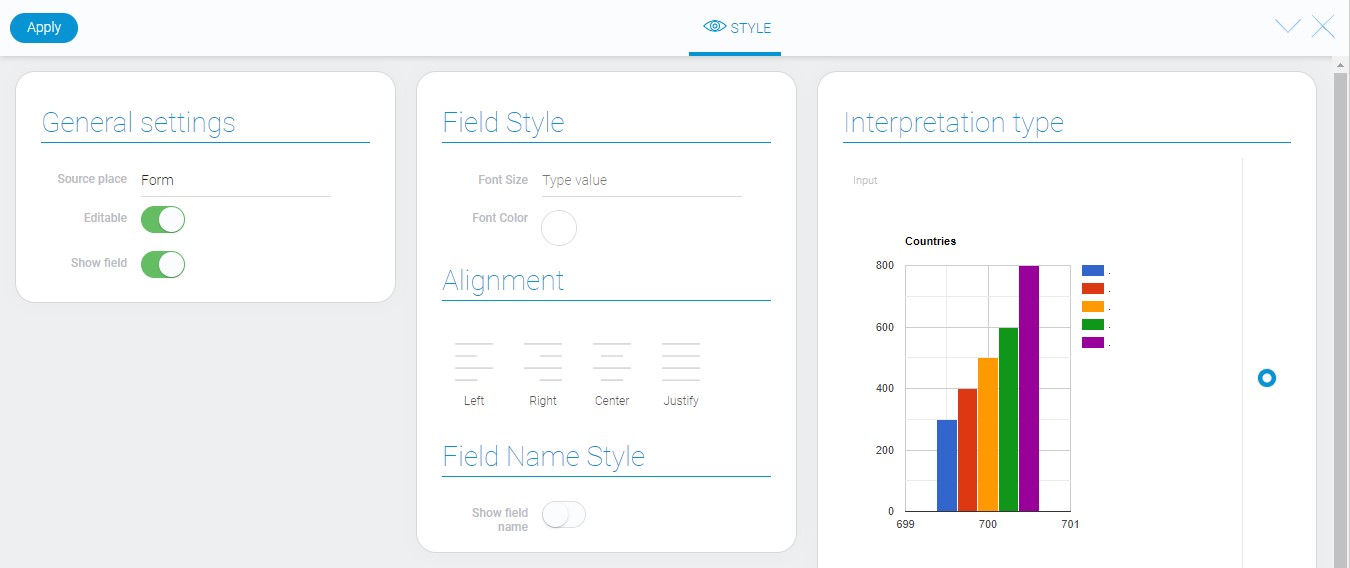
Current element has quite standard style settings. Also, it has only a few types of interpretation.
Filtration
This element cannot be filtered out.
Interpretation
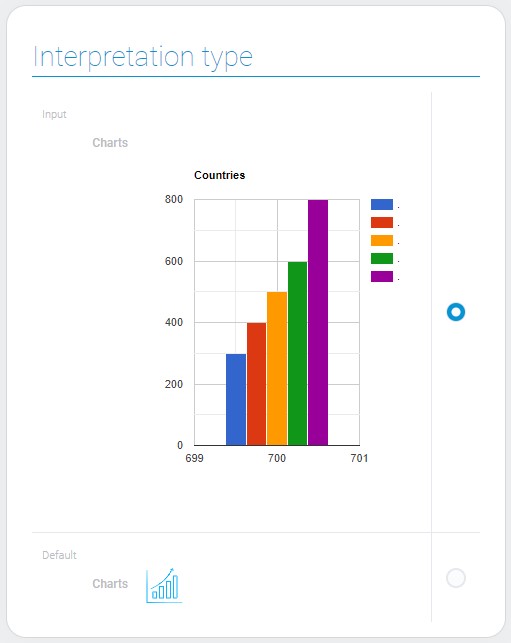
This element has only two interpretation types:
Input
This type allows the element be displayed as an interactive chart.
Default
This interpretation displays only an icon.
Value Format
The element does not have field value.
Data Model
The data model of the element contains all its settings:
{
    "data_model": {
        "app_id": "28840",
        "charts_option": [{
            "aggregation": "max",
            "field_id_calc": "680125",
            "field_to_sort": "680126",
            "filters_list": [],
            "name": "Bdd"
        }],
        "data_option": {
            "data_type": "month"
        },
        "height_charts": "200",
        "interpretation": [],
        "settings": {},
        "use_date_charts": 0,
        "use_save_mongo": false
    }
}
| Name | Type | Description |
|---|---|---|
| app_id | string |
contains ID of the source application |
| charts_option | array |
contains data about item options |
| aggregation | string |
contains type of the calculation |
| field_id_calc | string |
contains ID of the field by which the option value will be calculated |
| field_to_sort | string |
contains ID of the field by which the options will be sorted |
| filters_list | array |
contains filters that determine which items will be used for this option |
| name | string |
contains entered name of the option |
| data_option | object |
contains data about data options |
| data_type | string |
contains selected data type |
| height_charts | string |
contains value of the chart height |
| interpretation | array |
contains all interpretation types |
| settings | object |
contains all settings of the chart appearance |
| use_date_charts | boolean |
shows whether the date chart is used or not |
| use_save_mongo | boolean |
shows whether the chart data will be saved or not |

 Edit document